JonF
Posts: 634
Joined: Feb. 2005
|
| Quote (afdave @ Sep. 22 2006,13:32) | Hee hee hee hee ... says JonF ... he's laughing so hard at his wiley ways of tripping me up that he fails to notice that his own champion, Dalrymple himself, tries to prove meteorites are 4.6 BYO with a very similar graph ...
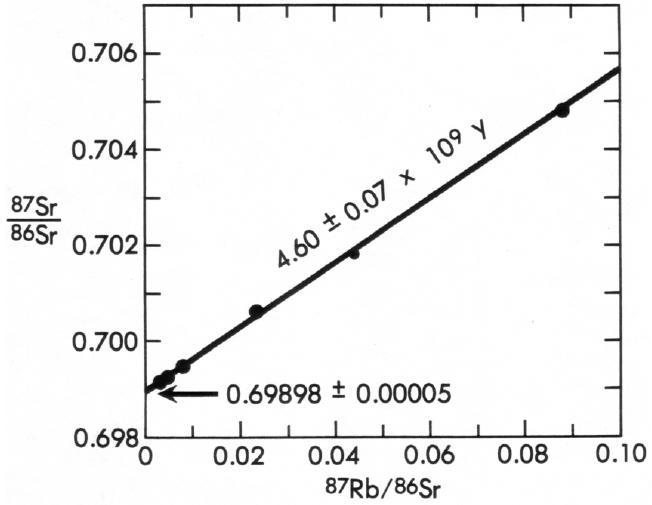
Figure 3: Rb-Sr isochron for the meteorite Juvinas. The points represent analyses on glass, tridymite and quartz, pyroxene, total rock, and plagioclase. After Faure (49). Data from Allegre and others (3).
Hey, Jon ... what would I get if I plotted this on a "normal" graph?
Pretty near a horizontal line, my friend! �See what the range is? �
0.0057 !!!!!!!!!!! |
Yup. A mere order of magnitude greater than Snelling's range. �Davie-dip, you're just proving my point, that yuor graph of Snelling's data is meaningless 'cause you used irrational axis scale choices.
But, Davie-doodles, you've tripped yourself up again. �The appropriate scale prtly depends on the data and partly depends on the overall real-world values. Dalrymple's data is fine, accurate and well above the threshold of the instrumentation. �So is Snelling's. �The range just happens to vary a lot, but both the X and Y ranges vary.
Notice the range on the X-axis too.
In Moorbath's data, approximately 20.
In Snelling's data, approximately 1.5. �(That's why it made sense for me to plot Snelling's data with 10% of the Y-range of Moorbath; Snelling's X and Y ranges are about 10% of Moorbath's, so the X axis was scaled OK already.)
In Dalrymple's data, �approximately 0.1.
So, when you calculate slopes (which is how you get ages), dividing delta Y by delta X, you get a significantly positive slope on Moorbath's plot, a significantly positive slope on Dalrymple's plot, and a significantly horizontal line on Snelling's plot. �Calculate what the rocks that Snelling sampled will be in a bilion years.
To make it even clearer, let's scale the data linearly (which won't affect the slope, but it'll mess up the intercept) so we can see all three sets on a comparable scale; for Moorbath, divide �X and Y by 10 and add 0.625 to Y, leaving the slope the same; for Dalrymple, multiply X and Y by 10 and subtract 6.29 from Y leaving the slope the same; and for Snelling, leave X and Y alone. �I'll just do the extreme points for Dalrymple and Moorbath, it's a pain trying to read them from the graph:

{ABE: I just swapped the picture; the original version had Dalrymple's data labeled as Moorbath's and vice versa. Wonder if Davie would have noticed that my graph had Isua older than Juivenas?}
It's clear, Davie-doodles; Snelling's data clearly shows a horizontal whole-rock isochron, insignificant variation in 87Sr/86Sr, and significant variation in 87Rb/86Sr. �Who was saying that's impossible?
� | Quote | Incidentally, what I showed with my graph is ...
a) WR Isochrons are useless (plotted on a fine scale, they are all over the map) ... hence useless.
b) WR Isochrons are useless (plotted on a "normal" scale they are a horizontal line) ... again useless. |
Um, Davie-doodles, WR isochrons for young rocks ... �"plotted on a "normal" scale they are a horizontal line" ... are far from useless ... 'cause when they age they aren't horizontal any more. Your graph demonstratges how useful WR isochrons are.
� | Quote | (But thanks for the zip file ... you're a good man anyway! |
And you're not, Davie, 'cause you're cutting and running from the discussions you promised.
|


 See what you get when you miss the decimal place.
 )
)