DiEb

Posts: 312
Joined: May 2008
|
| Quote (DiEb @ Feb. 15 2017,23:26) | | Quote (Wesley R. Elsberry @ Feb. 15 2017,18:06) | | Quote (DiEb @ Feb. 14 2017,12:16) | | Quote (WebHopper @ Feb. 14 2017,12:45) | | Quote (DiEb @ Feb. 13 2017,05:40) | | Frankly, I'm not sure what you mean by "trial"... |
The number of trials is the number of tries. When you roll dices for instance, a trial is when you throw the dice once. Or for the Weasel algorithm, it's the number of generations.
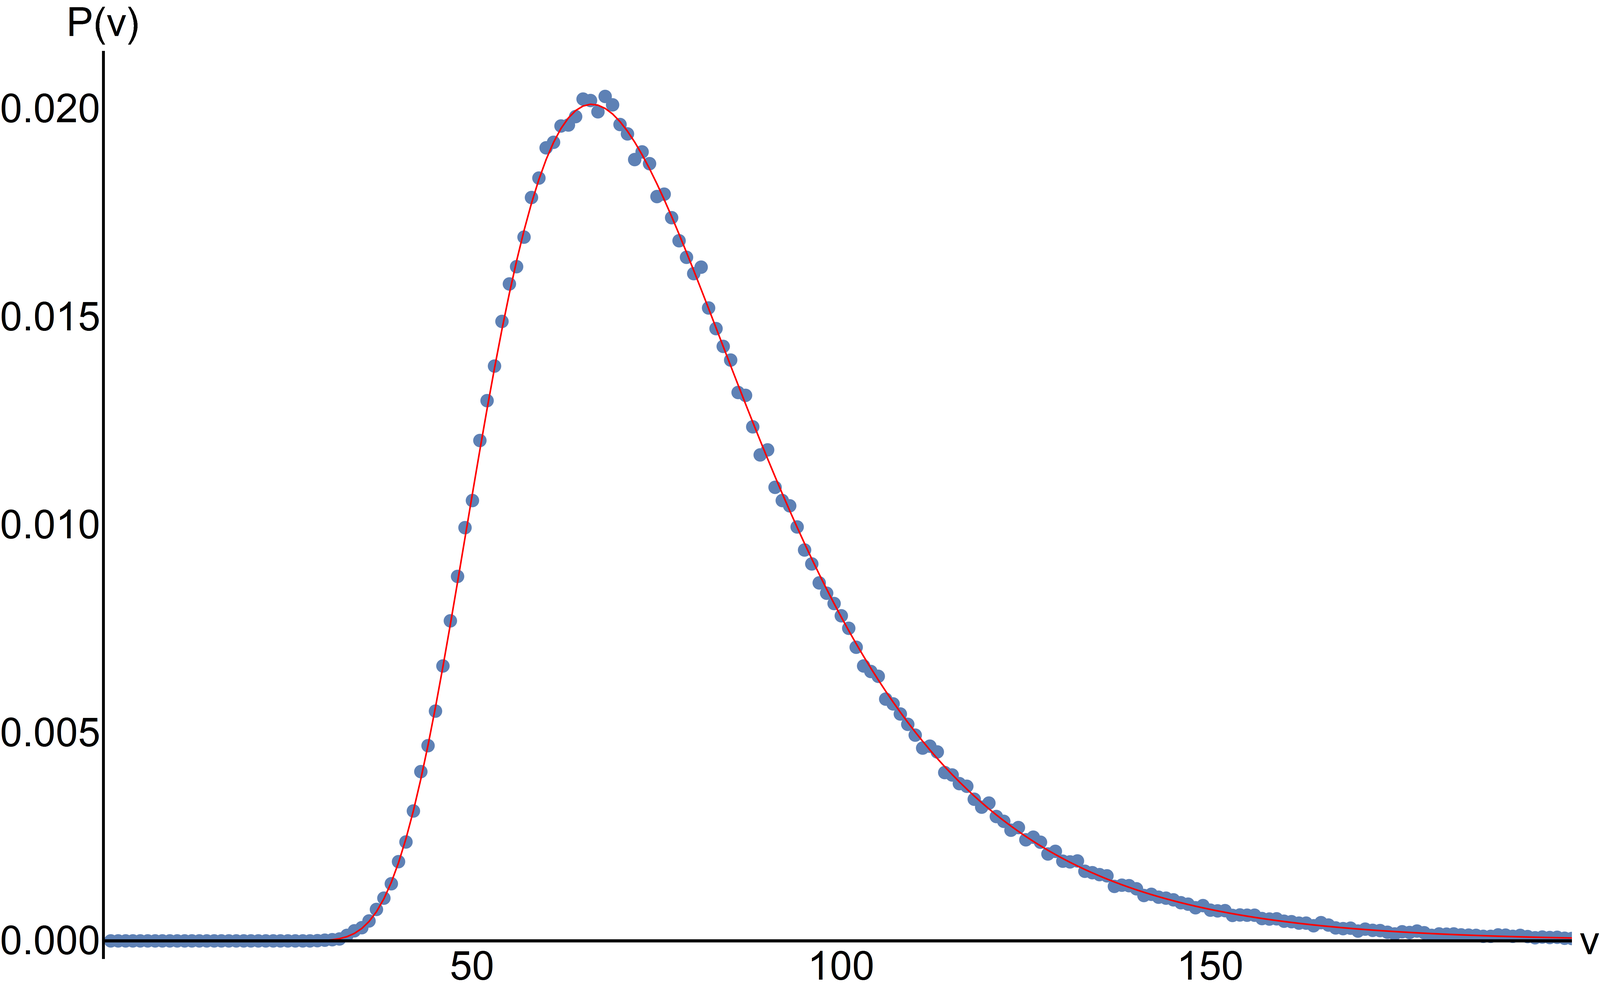
I calculated the probability distribution for the Weasel algorithm with a mutation rate of 0.05 and a population size of 100 according to Utiger's paper:
P(v)=|H.F^(v-2).A|
where v is the number of trials (or generations), H and F are matrices, A is a vector and |.| is the 1-norm. This yields

As you can see, the numerical blue points and the analytical red curve perfectly fit. The mean calculated analytically is 79.19 and the standard deviation is 24.64. So the number of queries is 100*79.19 = 7919 according to your indications. On your graphic above however, the intersection point of the vertical line at 5e-02=0.05 with the green curve passing through the point 100... is about 2e+05=2*10^5. This is the number of queries if I understand you well. So there is disagreement with both results... |
Great - I will try to find out where my error laid... |
Dieb, I don't think it is your error. The plot WebHopper has is for population size 100, and should have been run for population size 9 to speak to your numbers. |
Nevertheless, I'll look into it over the next week. Heck, I liked the picture, but something seems to be off.
I run a few simulations: WebHopper seems to be correct! Now, I have to go over eight year old code - from when I was young and pretty ;-) |
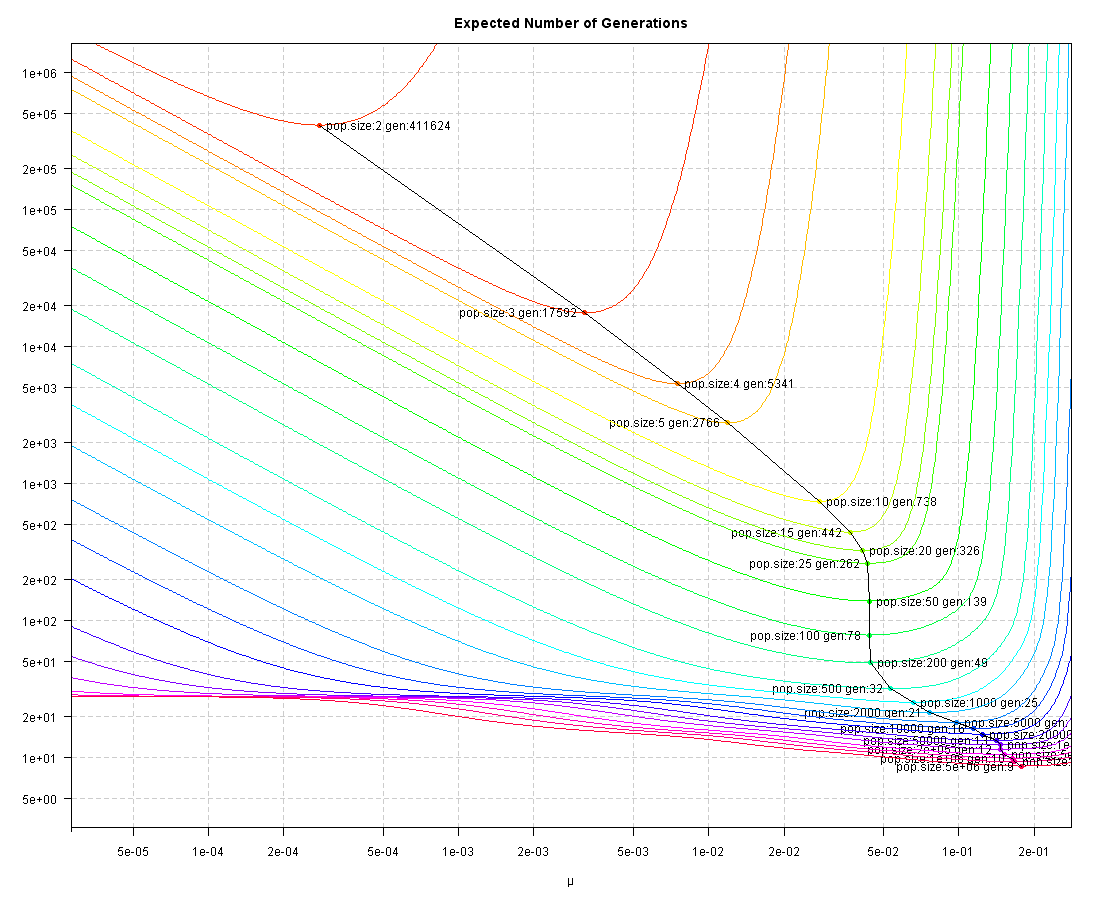
ARRRRGH! I don't know how I have managed it, but I uploaded two wrong pictures! Those belong to a blogpost from Oct 3, 2009 on Dembski's "Random Search" which had a target length of 100, and an alphabet of size 2 only!
The day before I wrote about Dawkin's weasel - here are the correct pictures for Dawkins:
The number of queries:

The number of generations:

i) for a population size of 100 and a mutation rate of 0.044, I get an expected number of generations of 78.47
ii) I still think that the number of individuals created best reflects the cost of the algorithm - a least mathematically: the onerous task is to create/mutate a child, using random numbers - in this sense, 10 generations of 10 children are equally expensive as one generation of 100 children.
Edited by DiEb on Feb. 16 2017,16:09
|


