afdave
Posts: 1621
Joined: April 2006
|
THE USELESSNESS OF WHOLE ROCKS ISOCHRONS ILLUSTRATED
(What Arndts and Overn are saying, but in pictures)
http://tccsa.tc/articles/isochrons2.html
Again, here is basically what they are saying ...
Whole rock isochrons are inconclusive for demonstrating Deep Time. �Why? �Because they can better (more probably) be explained as the result of mixing.
Let's illustrate what we are talking about ...
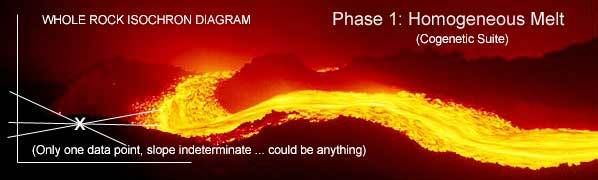
The above picture shows a typical lava flow. �Now the theory says that for the isochron to be valid, the initial Sr ratio of 87Sr/86Sr is HOMOGENEOUS. �Now one could argue whether or not the flow above is actually homogeneous, but for the whole rock isochron method to work, this is the assumption. �The typical assumed initial value is around 0.70 depending on whether you are talking about island volcanoes or continental volcanoes. �I think it's a little higher for contintental. �But in any case, it is ASSUMED to be homogeneous. �Now IF the 87Sr/86Sr ratio is homogeneous, this means that the 87Rb/86Sr ratio is ALSO homogeneous, and this means that we would have only ONE data point on the isochron diagram if we were to analyze any sample in the lava flow.
Now let's consider what happens after it cools and solidifies. �As JonF has pointed out, WHILE it is cooling, many different mineral crystals will form at different rates and will accept and/or reject Sr and Rb in different ways. �Also note that both of these "foreigners" (they are foreign to the normal crystal structure) are mobile far below the melting temperature of the different mineral crystals. �So just because a particular mineral accepts or rejects Sr or Rb initially as it is forming doesn't not mean it will stay there. �Either atom can leave or show up in any crystal during the cooling process. �
Now, what we want to note is that none of this discussion above has any bearing at all with the Whole Rock Isochron. �Individual mineral crystals can go through as many gymnastics as they want to and none of this will change the overall composition of a large sample of the lava flow. �So, what do we have? �We have this ...
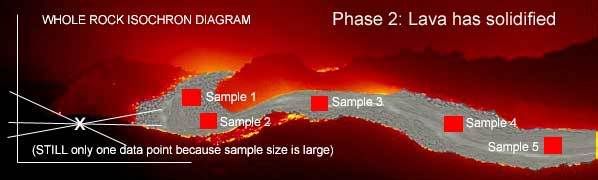
As you can see, nothing has changed on the isochron diagram ... we still only have one data point, simply because of the assumption of initial homogeneity and the fact that we are taking large sample sizes. �Now Arndts and Overn recognize that the "One Data Point" problem can be solved by the Mineral Isochron method, and they are correct, because mineral crystals provide the needed inhomogeneity. �But the mineral isochron method does not help us "date" the whole rock for reasons which Overn and Arndts explain and I won't repeat here. �Suffice to say for the moment that IF the initial homogeneity assumption is true, then the whole rock isochron plot will yield only one data point, which, of course is useless for dating rocks.
OK? �Is everybody with me?
Now that we understand homogeneity and cogenetic suites, let's consider 2 LAVA FLOWS. �Let's assume that these are of different compositions as indicated by the different positions of the single points on the respective isochron diagrams. �What happens when these two flows get mixed? �Well, let's watch and see ...
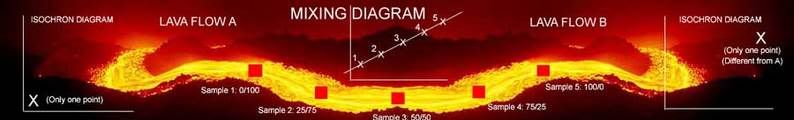
In the picture above, you can see that some of the lava is not mixed at all and some is mixed partially. �We have represented this with percentages of Flow A and Flow B -- 100/0, 75/25, etc.
Now your own beloved Talk Origins website has a discussion of this here http://www.talkorigins.org/faqs/isochron-dating.html
They have a good discussion of this a little over halfway down the article entitled "Mixing of two sources" where they show exactly what I have shown. �You can even put this in a Spreadsheet and play with the percentages and you will see that the mixing points ALWAYS lie on a line between the two end points which, of course, are merely the single point isochron diagrams of two distinct sources with different composition.
They even say this ... | Quote | | Mixing would appear to be a pernicious problem. Since A and B can be completely unrelated to each other, their individual compositions could plot to a fairly wide range of locations on the graph. The line AB could have any slope at all. |
Pernicious indeed! �Actually, the word I would use is "FATAL." �The T.O. article goes on to relate the "Mixing Test" from Faure, but I don't get the impression that the author really understands the mixing test. �He does not say much, other than to give a simple reciprocal test which supposedly approximates Faure's rigorous test. �And I don't think even Faure claims that the mixing test proves conclusively that mixing is not a possibility. �If he does, I think he is wrong.
After working through all of this and understanding the assumptions and details of the whole rock isochron method, I have to say that I agree with Arndts and Overn is concluding that ALL whole rock isochron diagrams can be interpreted as mixing diagrams and there is really no way to prove that they are not. �And with what we now know of earth processes, it makes total sense to interpret them as mixing diagrams.
Now, of course, there is the remote POSSIBILITY that all these WR isochron diagrams out there do, in fact, indicate true age. �I freely admit that this is a rational possibility.
But my point today is what Overn and Arndt's point is also ...
WHOLE ROCK DIAGRAMS CAN ALL BE EXPLAINED AS MIXING DIAGRAMS ... IN FACT, THIS IS A BETTER EXPLANATION THAN DEEP TIME WHEN YOU CONSIDER MANY OTHER "EARTH AGE INDICATORS."
(Who was that bozo that said Creationists don't consider ALL the evidence? �Heh heh!
**********************************
Now where does this leave us with the Minster plot of the 23 meteorites?
Simple. �There are at least three possible conclusions and I have touched on two of them ...
1) �Deep Time is indicated
2) �The data was cherry picked as my hypothetical plot with "cherries" on it indicates
3) �The plot is nothing more than a mixing plot
Now my guess is (3) ... how can this be? �Well, what are meteorites anyway? �Where did they come from? �I don't know and you don't either, but a good guess, I suppose is that they are the remains of some great collision of two planets which may have formed the asteroid belt. �Here's the Wikipedia article on meteorites ...
http://en.wikipedia.org/wiki/Meteorites
Note that it says ... | Quote | | As of mid-2006, there are approximately 1050 witnessed falls having specimens in the world's collections. In contrast, there are over 31,000 well-documented meteorite finds[1]. |
Wow. �31,000 and the Minster plots analyzes 23. �OK.
But anyway, back to where they came from ... I don't think anyone one really knows, so educated guesses is really all we have. �Could they have come from a single mixed source relatively recently? �Of course. Just as we have seen from the study above. �It is entirely plausible that these meteorites are fragments of a planet or two planets or two moons or what have you, and we have just seen how the plots can be the result of mixing. �Two independent sources, each with their own single point isochron diagrams on one or more planets �or moons could have been heated, then flowed and experienced partial mixing. �In fact, they probably did. �Then when the big collision occurred, the pieces got scattered and wound up in the asteroid belt, then made their way to earth. �Totally possible, completely plausible. �One can think of a hundred different variations on this theme to envision how these meteorites got here.
Can the Minster plot be indicative of Deep Time? �Of course, if no other data is considered. �But we must consider other data, and when we do, Deep Time is not indicated.
--------------
A DILEMMA FOR THE COMMITTED NATURALIST
A Hi-tech alien spaceship lands on earth ... DESIGNED.
A Hi-tech alien rotary motor found in a cell ... NOT DESIGNED.
http://afdave.wordpress.com/....ess.com
|